Romania & CoVID-19
DATA Description
The data sets used are of the COVID-19 virus, containing data on all countries. The first data set contains the total cases, new cases, cases per million of the countries population, total deaths, new deaths, new tests, total tests and stingency index. The data set has extensive variables, however, not all are used in this blog. The data set was obtained from here. The first set although extensive, did not contain the variable of cases recovered. A second data set was used to obtain the cases recovered from here.
Key Variables
| variables | class | description |
|---|---|---|
| Date | Date | Date for the cases recorded |
| New_cases | Numeric | new cases recorded on a particular day |
| Cases_per_million | Numeric | cases recorded per million of the country’s population |
| Total_deaths | Numeric | total deaths recorded |
| New_deaths | Numeric | new deaths recorded |
| New_tests | Numeric | new tests conducted each day |
| Total_tests | Numeric | number of tests performed |
| Stringency Index | Numeric | governments response to the pandemic |
| recovered | Numeric | number of covid-19 cases recovered |
Why Romania?
Romania is part of the European Union, according to Wikipedia, Romania is the largest country in Southeastern Europe and the twelfth-largest in Europe, having an area of 238,397 square kilometres. According to the 2011 census, Romania’s population is 20,121,641. As part of the European Union, Romania attracts a lot of tourism; the number of tourists has been rising steadily, reaching 9.33 million foreign tourists in 2016, according to the World Bank.
We are going to be looking into at what scale the Covid-19 affected Romania and how did Romania try to contain it.
Methodology
The data sets contain information on Covid-19 cases on all countries of the world, hence, we will filter it to give us details only on Romania. Only variables that are needed will be selected for exploration. The first covid-19 case was reported in Romania on 2020-02-27.
First, identify the ratio of tests and positive tested for covid-19.
The plot shows how many tests were performed and how many people tested positive for covid-19, color coded by the month. Interacting with the graph shows a growth in tested-positive cases. Try selecting the month by double clicking.
With an increasing trend in the number of patients diagnosed with covid-19, we need to look at the recovery-to-death ratio.
The data shows that the death ratio has been low in comparison to recovery. The highest death count was recorded in the month of August at 58. Meanwhile, in the month of July, the highest number of patients recovered were recorded at 1,707. There is no particular trend in the recovered to death ratio, however, death count increased in August. You can look at it yourself by interacting with the Month legend; just double click on the month you want to select.
Romanain Governments’ Response
How did the government handle this in Romania? For this, we will be looking into the stringency index, which in layman terms translates into the level of emergency imposed or the governments’ response to the pandemic spread.
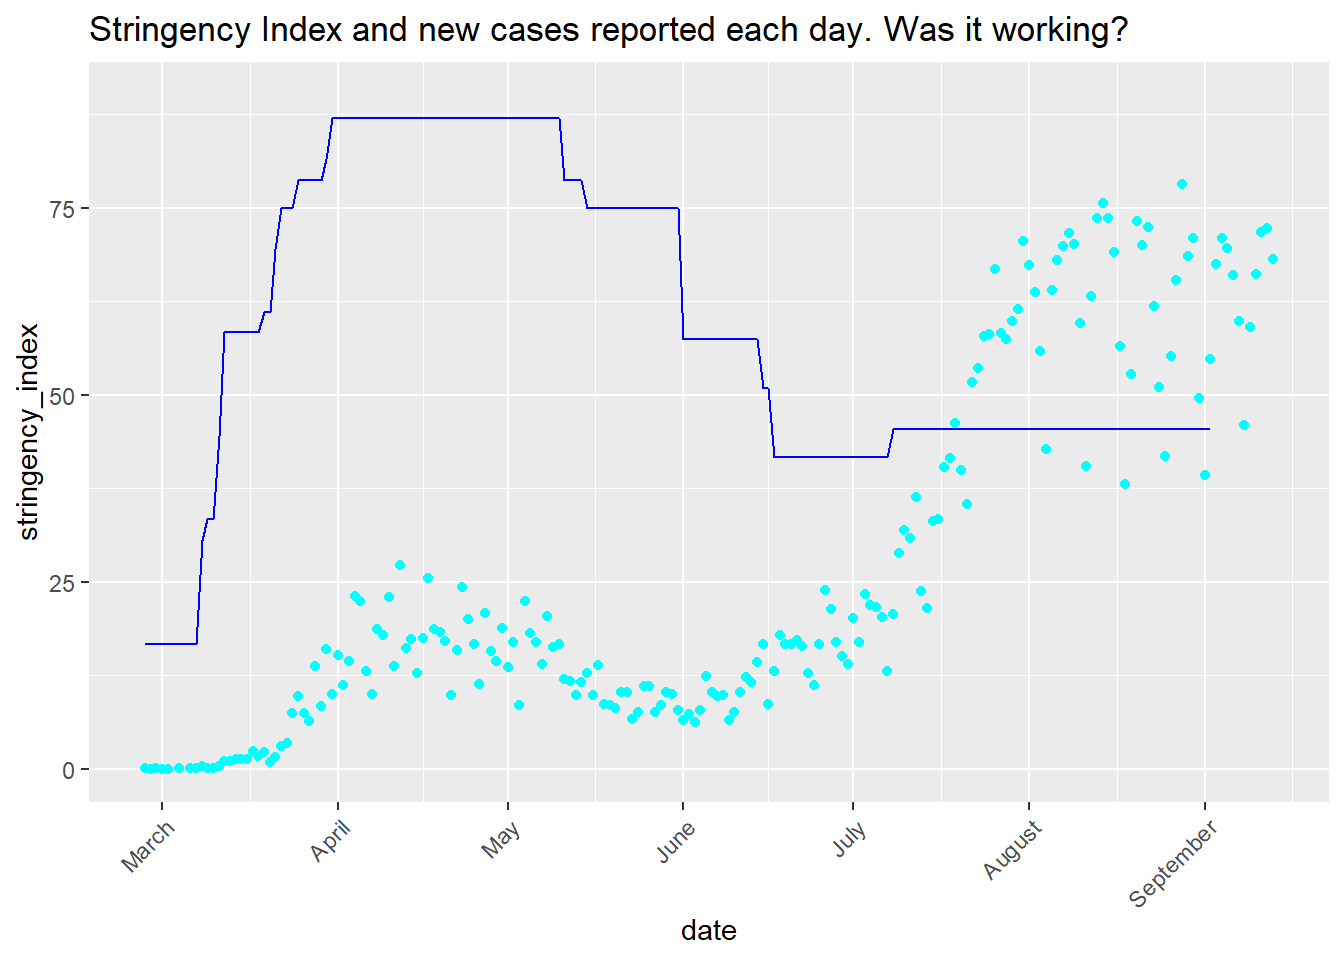
The higher the stringency the more the measures taken to get the situation under control. With an increase in the number of cases, the Romanian Government implemented plans to get control on the situation as mentioned in this article. The stringency rate jumped from 16.67% to 58.33% in March. Travel restrictions were imposed, as mentioned here.
In April, fines and penalties were imposed to discourage citizens to break the lockdown regulations, as mentioned in this article. The stringency index jumped from 58.33% to 87.04%.
In May, some measures were relaxed on the previous lockdown policy, as mentioned here, dropping the stringency index from 87.045 to 75%.
In June, the Romanian Government decided to relax the restrictions and resume social and economic activity. More details are provided here, further dropping the stringency index from 75% to 54.41% and towards the end of June, the index dropped to 41.67%.
After a surge in cases, the Romanian Government announced new bylaws to be followed to get the cases under control without restricting the social and economic health of the country. All the measures are mentioned here. With these new regulations, the stringency index increased from 41.67% to 45.37% and has been stable ever since, from July to August.
Was the Stringency working?
The figure below shows the stringency index with the new cases reported, which lets us know the effectiveness of the Romanian Government. The figure speaks for itself; during the initial spike the increase in the stringency level did control the new cases reported. However, cases spiked as soon as the regulations were relaxed which is to be expected. Overall having a direct relation between the level of stringency and new cases reported.
References
Coronavirus Pandemic (COVID-19) – the data. (2020). Retrieved 18 September 2020, from https://ourworldindata.org/coronavirus-data
RamiKrispin/coronavirus. (2020). Retrieved 18 September 2020, from https://github.com/RamiKrispin/coronavirus
Romania. (2020). Retrieved 18 September 2020, from https://en.wikipedia.org/wiki/Romania
What is Stringency Index? - INSIGHTSIAS. (2020). Retrieved 18 September 2020, from https://www.insightsonindia.com/2020/05/09/what-is-stringency-index/#:~:text=The%20Stringency%20Index%20is%20a%20number%20from%200,used%20by%20the%20Oxford%20COVID-19%20Government%20Response%20Tracker.
Continuarea măsurile de prevenire și limitare a eventualelor îmbolnăviri cu noul coronavirus. (2020). Retrieved 18 September 2020, from https://stirioficiale.ro/informatii/continuarea-masurile-de-prevenire-si-limitare-a-eventualelor-imbolnaviri-cu-noul-coronavirus
Comunicat de presă 20 martie, ora 9:36am. (2020). Retrieved 18 September 2020, from https://stirioficiale.ro/informatii/comunicat-de-presa-20-martie-ora-9-36am
BULETIN DE PRESĂ 2 Aprilie 2020, ora 13.00. (2020). Retrieved 18 September 2020, from https://stirioficiale.ro/informatii/buletin-de-presa-2-aprilie-2020-ora-13-00
Informare de presă 9 mai 2020, ora 1:23 pm. (2020). Retrieved 18 September 2020, from https://stirioficiale.ro/informatii/informare-de-presa-9-mai-2020-ora-1-23-pm
Precizări de presă 15 iunie 2020. (2020). Retrieved 18 September 2020, from https://stirioficiale.ro/informatii/precizari-de-presa-15-iunie-2020
INFORMARE DE PRESĂ - 21 iulie 2020, ora 11.37. (2020). Retrieved 18 September 2020, from https://stirioficiale.ro/informatii/informare-de-presa-21-iulie-2020-ora-11-37
Packages
v1.3.1, r. (2020). readr package | R Documentation. Retrieved 18 September 2020, from https://www.rdocumentation.org/packages/readr/versions/1.3.1
v3.3.2, g. (2020). ggplot2 package | R Documentation. Retrieved 18 September 2020, from https://www.rdocumentation.org/packages/ggplot2/versions/3.3.2
v0.7.8, d. (2020). dplyr package | R Documentation. Retrieved 18 September 2020, from https://www.rdocumentation.org/packages/dplyr/versions/0.7.8
Wickham, H. (2020). Easily Install and Load the ‘Tidyverse’ [R package tidyverse version 1.3.0]. Retrieved 18 September 2020, from https://cran.r-project.org/web/packages/tidyverse/index.html
v0.8.3, t. (2020). tidyr package | R Documentation. Retrieved 18 September 2020, from https://www.rdocumentation.org/packages/tidyr/versions/0.8.3
plotly/plotly.py. (2020). Retrieved 18 September 2020, from https://github.com/plotly/plotly.py
RamiKrispin/coronavirus. (2020). Retrieved 18 September 2020, from https://github.com/RamiKrispin/coronavirus
Auguie, B. (2020). Miscellaneous Functions for “Grid” Graphics [R package gridExtra version 2.3]. Retrieved 18 September 2020, from https://cran.r-project.org/web/packages/gridExtra/index.html
v1.7.9, l. (2020). lubridate package | R Documentation. Retrieved 18 September 2020, from https://www.rdocumentation.org/packages/lubridate/versions/1.7.9
v1.2.1, k. (2020). kableExtra package | R Documentation. Retrieved 18 September 2020, from https://www.rdocumentation.org/packages/kableExtra/versions/1.2.1

Muhammad Soban Qasim
Student of Business Analytics
My research interests include distributed robotics, mobile computing and programmable matter.